import numpy as np
import matplotlib.pyplot as plt
import time
%matplotlib inline


# 1. simple plot in line
x, y = [1, 2, 3], [2, 8, 6]
x2, y2 = [1, 2, 3], [12, 15, 10]
plt.plot(x, y, label = "quarter 1")
plt.plot(x2, y2, label = "quarter 2")
plt.xlabel('studend id')
plt.ylabel('score')
plt.title('simple plot')
plt.legend()

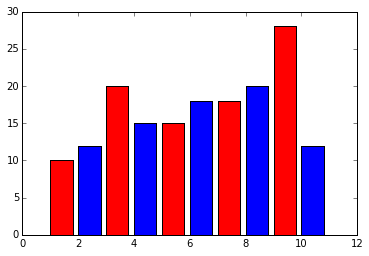
# 2. bar plot
x, y = [1, 3, 5, 7, 9], [10, 20, 15, 18, 28]
x2, y2 = [2, 4, 6, 8, 10], [12, 15, 18, 20, 12]
plt.bar(x, y, label = 'bar 1', color = 'r')
plt.bar(x2, y2, label = 'bar 2', color = 'b')
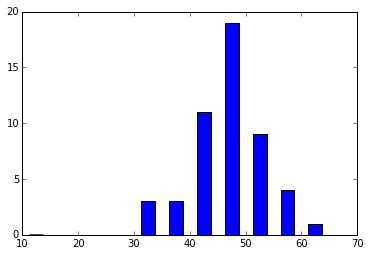
# 3. histogram
y = np.random.poisson(45, 50)
bins = range(10, 70, 5)
plt.hist(y, bins, histtype = 'bar', rwidth = 0.5)
(array([  0.,   0.,   0.,   0.,   3.,   3.,  11.,  19.,   9.,   4.,   1.]),
 array([10, 15, 20, 25, 30, 35, 40, 45, 50, 55, 60, 65]),
 <a list of 11 Patch objects>)
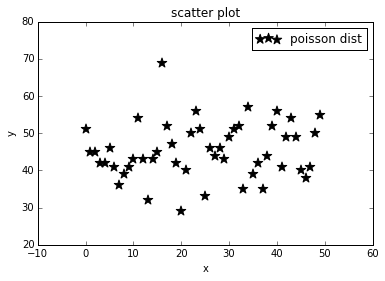
# 4. scatter plot
y = np.random.poisson(45, 50)
x = range(len(y))

plt.scatter(x, y, label = "poisson dist", color = 'k', marker = '*', s = 100)
plt.xlabel('x')
plt.ylabel('y')
plt.title('scatter plot')
plt.legend()
# read in the stock data
import numpy as np
import matplotlib.pyplot as plt
import matplotlib.dates as mdates

def bytespdate2num(fmt, encoding = 'utf8'):
    strconverter = mdates.strpdate2num(fmt)
    def bytesconverter(b):
        s = b.decode(encoding)
        return strconverter(s)
    return bytesconverter

def graph_data():
    '''
        numpy.loadtxt to read in data in a list and format the data
    '''
    with open(r'h:\python\data\yahoo_fin_data.csv') as f:
        source_data = f.read().split('\n')

    source_data = [x for x in source_data if len(x) > 0]
    date, closep, highp, lowp, openp, volume = np.loadtxt(source_data, delimiter = ',',
                                                          unpack = True, converters = {0: bytespdate2num('%Y%m%d')})

    plt.plot_date(date, closep, '-')
    plt.show()

graph_data()
# another way is to read in the json file
import json
import pandas as pd

readf = open(r'H:\python\data\yahoo_fin').read()
# data is like  " 'finance_charts_json_callback( { ", need to remove this by split
data_dict = readf.split('(')[1].split(')')[0]  # re.findall('\((.*?)\)', readf.replace('\n', ''))[0]
# data is in in dict with key = 'series'
json_data = json.loads(data_dict)['series']
final_df = pd.DataFrame(json_data)
print final_df.head()
       Date   close    high      low    open   volume
0  20151229  776.60  779.98  766.430  766.69  1765000
1  20151230  771.00  777.60  766.900  776.60  1293300
2  20151231  758.88  769.50  758.340  769.50  1489600
3  20160104  741.84  744.06  731.258  743.00  3272800
4  20160105  742.58  752.00  738.640  746.45  1950700
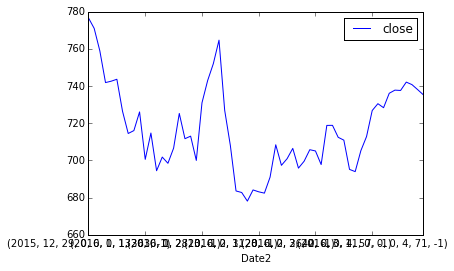
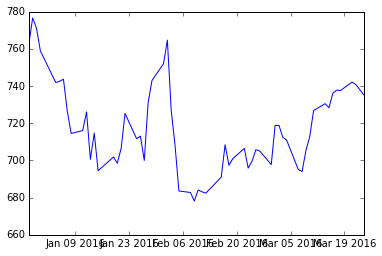
import time
final_df['Date2'] = final_df['Date'].map(lambda x: time.strptime(str(x), '%Y%m%d'))
final_df.plot('Date2', 'close')
plt.show()