This is to show how to read in the csv file, create QComboBox from the columns in the read in data, slice data with conditions from the QComboBox and at last, plot the selected subset data to compare.
A QFileDialog will be poped up to let the user select the csv file to read in. After read the csv file, update the QComboBox of the rating and year_quarter.
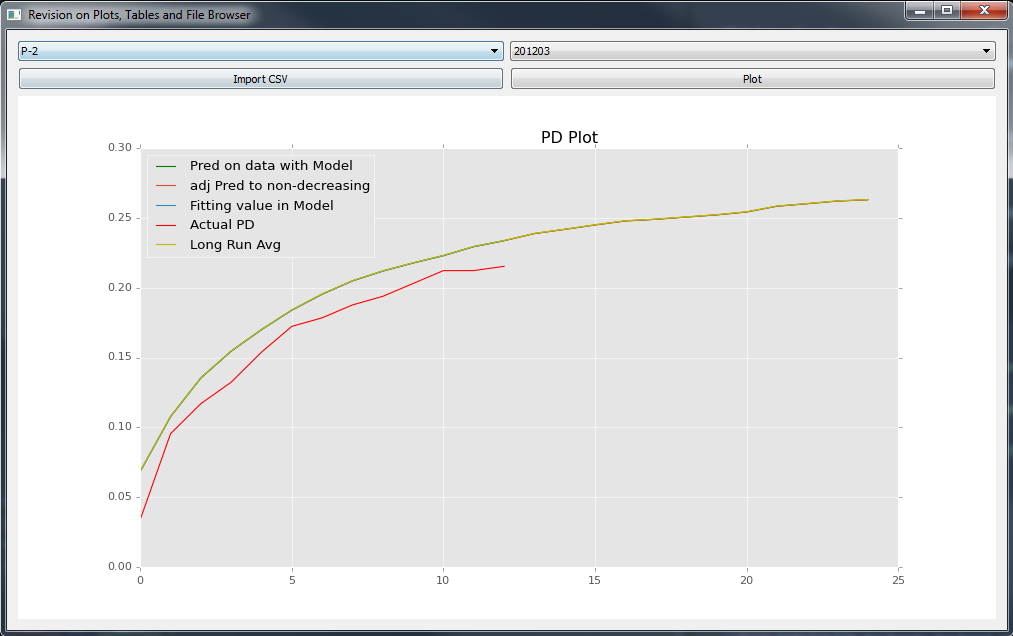
For any currentText in the QComboBox, select the subset data and plot it.
tip: 读入csv data以后,把它assign给self.df,这样就在class里面变成全局变量,对应的self.rating_list和self.yq_list也是这意思。
'''
20160516: in v3, try to read in the csv file through menu rather than do this in the code, but v3 does not work

20160516: in v2, try to use dropdown menu to select data

20160515 in this v1, we can input the rating and year_quarter in the first and second cell of the table and then plot the result.
'''

from PyQt4 import QtGui
import os, sys
import numpy as np
import pandas as pd
import matplotlib.pyplot as plt
from matplotlib import style
from matplotlib.backends.backend_qt4agg import FigureCanvasQTAgg as FigureCanvas

style.use('ggplot')


class PrettyWidget(QtGui.QWidget):


    def __init__(self):
        super(PrettyWidget, self).__init__()
        self.initUI()

    def initUI(self):
        self.setGeometry(600,300, 1000, 600)
        self.center()
        self.setWindowTitle('Revision on Plots, Tables and File Browser')

        #Grid Layout
        grid = QtGui.QGridLayout()
        self.setLayout(grid)

        #Canvas and Toolbar
        self.figure = plt.figure(figsize=(15,5))
        self.canvas = FigureCanvas(self.figure)
        grid.addWidget(self.canvas, 2,0,1,2)


        #Import CSV Button
        btn1 = QtGui.QPushButton('Import CSV', self)
        btn1.resize(btn1.sizeHint())
        btn1.clicked.connect(self.getCSV)
        grid.addWidget(btn1, 1, 0)

        #DropDown mean / comboBox

        self.df = pd.DataFrame()
        self.rating_list = []
        self.yq_list = []

        self.comboBox = QtGui.QComboBox(self)
        self.comboBox.addItems(self.rating_list)
        grid.addWidget(self.comboBox, 0, 0)

        self.comboBox2 = QtGui.QComboBox(self)
        self.comboBox2.addItems(self.yq_list)
        grid.addWidget(self.comboBox2, 0, 1)

        #Plot Button
        btn2 = QtGui.QPushButton('Plot', self)
        btn2.resize(btn2.sizeHint())
        btn2.clicked.connect(self.plot)
        grid.addWidget(btn2, 1, 1)

        self.show()


    def getCSV(self):
        filePath = QtGui.QFileDialog.getOpenFileName(self,
                                                    'CSV File',
                                                    '~/Desktop/PyQt4',
                                                    '*.csv')
        print filePath
        self.df = pd.read_csv(str(filePath))
        self.rating_list = self.df.rating.unique().tolist()
        self.yq_list = [str(x) for x in self.df.yq.unique().tolist()]
        self.comboBox.addItems(self.rating_list)
        self.comboBox2.addItems(self.yq_list)
        print self.rating_list


    def plot(self):
        y = []
        for n in range(3):
            try:
                y.append(self.table.item(0, n).text())
            except:
                y.append(np.nan)

        p1 = self.df.ix[(self.df.rating ==  str(self.comboBox.currentText())) & (self.df.yq ==  int(str(self.comboBox2.currentText()))), :]
        print p1

        plt.cla()


        ax = self.figure.add_subplot(111)
        ax.plot(p1.ix[:, 0], 'g', label = "Pred on data with Model")
        ax.plot(p1.ix[:, 1], label = "adj Pred to non-decreasing")
        ax.plot(p1.ix[:, 3], label = "Fitting value in Model")
        ax.plot(p1.ix[:, 2], 'r', label = "Actual PD")
        ax.plot(p1.ix[:, 4], 'y', label = "Long Run Avg")

        ax.set_title('Canada C&I PD Plot')
        ax.legend(loc = 0)
        self.canvas.draw()


    def center(self):
        qr = self.frameGeometry()
        cp = QtGui.QDesktopWidget().availableGeometry().center()
        qr.moveCenter(cp)
        self.move(qr.topLeft())


def main():
    app = QtGui.QApplication(sys.argv)
    w = PrettyWidget()
    app.exec_()


if __name__ == '__main__':
    main()
Figure 1. ready to read in csv
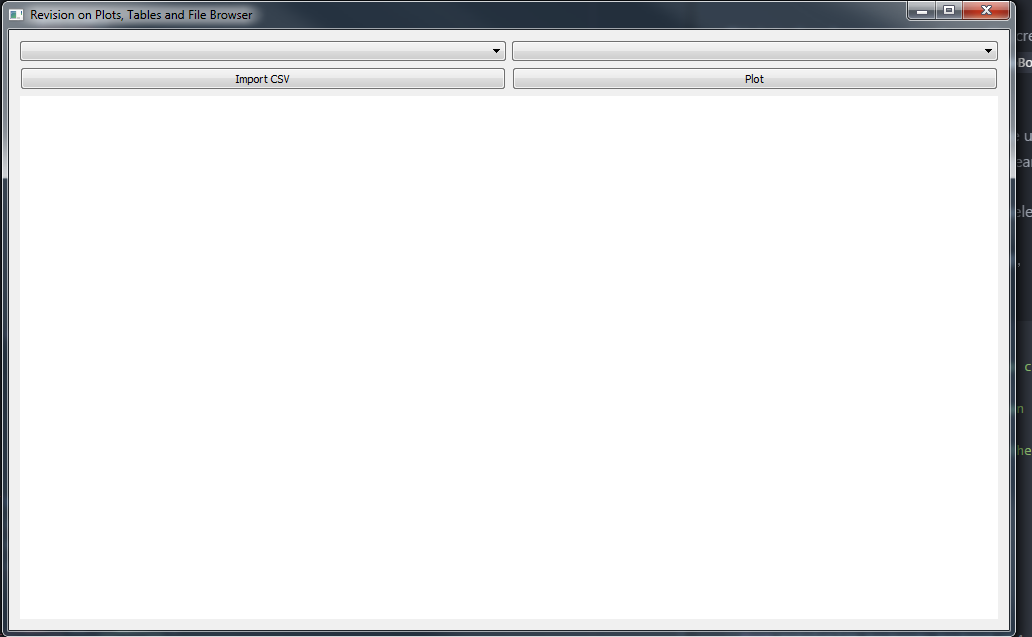
Figure 2. read in csv
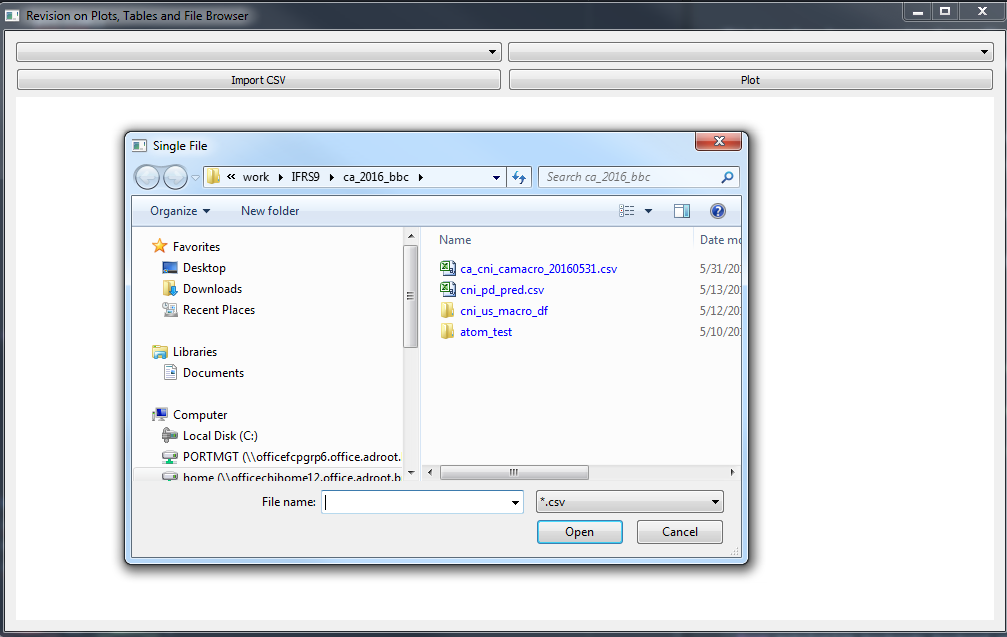
Figure 3. after read in csv, update comboBox and plot subset data