跟第二版|第一版的区别:
1. 主窗口从QMainWindow继承过来,而不是从QWidget. 所有的控件加载在main_frame (main_frame 是一个QWidget)上,然后QWidget加载到QMainWindow上
-
每个tab是一个
QWidget, 三个tab都放在tab_frame (QTabWidget)上,然后tab_frame加载到main_frame的gridlayout上 -
在每个tab上都能看到import_csv和combobox,所以它们跟tab_frame平级,被加载到main_frame的gridlayout上
-
模块化一些产生控件的code. 比如
create_menu,create_status_bar,create_main_frame,create_action等等 -
df在tab2上可以使用
to_string或者to_html,使用to_string需要改字体,否则不对齐 -
model原来的格式是
scipy.summary,没有to_string或者to_html,只能用str强制转换为string,然后改字体显示
To do next:
-
添加选项:plot的时候可以选择plot哪些变量
-
处理异常
'''
20160610 in v5: add tabs(QTabWidget) to the QMainWindow
20160531 in v4: try to re-arrange the widgets with QMainWindow
20160516: in v3, try to read in the csv file through menu rather than do this in the code, but v3 does not work
20160516: in v2, try to use dropdown menu to select data
20160515 in this v1, we can input the rating and year_quarter in the first and second cell of the table and then plot the result.
'''
from PyQt4 import QtGui, QtCore
import os, sys
import numpy as np
import pandas as pd
import matplotlib.pyplot as plt
from matplotlib import style
from matplotlib.backends.backend_qt4agg import FigureCanvasQTAgg as FigureCanvas
style.use('ggplot')
class PrettyWidget(QtGui.QMainWindow):
def __init__(self, parent = None):
super(PrettyWidget, self).__init__(parent)
self.setWindowTitle('Revision on Plots, Tables and File Browser')
self.create_menu()
self.create_main_frame()
self.create_status_bar()
def create_main_frame(self):
self.main_frame = QtGui.QWidget()
self.add_tabs()
# add grid on main_frame to put the widgets
self.grid = QtGui.QGridLayout()
self.setLayout(self.grid)
#Import CSV Button
btn1 = QtGui.QPushButton('Import CSV', self)
btn1.resize(btn1.sizeHint())
btn1.clicked.connect(self.getCSV)
self.grid.addWidget(btn1, 1, 0, 1, 2)
#DropDown mean / comboBox
self.df = pd.DataFrame()
self.rating_list = []
self.yq_list = []
self.comboBox = QtGui.QComboBox(self)
self.comboBox.addItems(self.rating_list)
self.grid.addWidget(self.comboBox, 0, 0)
self.comboBox2 = QtGui.QComboBox(self)
self.comboBox2.addItems(self.yq_list)
self.grid.addWidget(self.comboBox2, 0, 1)
self.grid.addWidget(self.tab_frame, 2, 0, 2, 2)
self.main_frame.setLayout(self.grid)
self.setCentralWidget(self.main_frame)
self.show()
def add_tabs(self):
self.tab_frame = QtGui.QTabWidget()
self.tab1 = QtGui.QWidget()
self.tab2 = QtGui.QWidget()
self.tab3 = QtGui.QWidget()
#Grid Layout
grid = QtGui.QGridLayout()
self.setLayout(grid)
#Canvas and Toolbar
self.figure = plt.figure(figsize=(15,5))
self.canvas = FigureCanvas(self.figure)
grid.addWidget(self.canvas, 2,0,1,2)
#Plot Button
btn2 = QtGui.QPushButton('Plot', self)
btn2.resize(btn2.sizeHint())
btn2.clicked.connect(self.plot)
grid.addWidget(btn2, 1, 0, 1, 2)
# add Widget to the Tabs
self.tab1.setLayout(grid)
# add Tabs to the tab_frame
self.tab_frame.addTab(self.tab1, "Plot Data")
# prepare for the 2nd tab
self.tab2Form = QtGui.QFormLayout()
btn3 = QtGui.QPushButton('Print Data', self)
btn3.resize(btn3.sizeHint())
btn3.clicked.connect(self.print_data)
self.tab2Form.addRow(btn3)
self.textEdit = QtGui.QTextEdit()
self.textEdit.setMinimumSize(800, 600)
self.tab2Form.addRow(self.textEdit)
self.tab2.setLayout(self.tab2Form)
self.tab_frame.addTab(self.tab2, "Show Data")
# prepare for the 3rd tab
self.creSelectModel = {'I-5': 'test'}
self.tab3Form = QtGui.QFormLayout()
btn4 = QtGui.QPushButton('Show Model', self)
btn4.resize(btn4.sizeHint())
btn4.clicked.connect(self.show_model)
self.tab3Form.addRow(btn4)
self.textEdit3 = QtGui.QTextEdit()
self.textEdit3.setMinimumSize(800, 600)
self.tab3Form.addRow(self.textEdit3)
self.tab3.setLayout(self.tab3Form)
self.tab_frame.addTab(self.tab3, "Show Model")
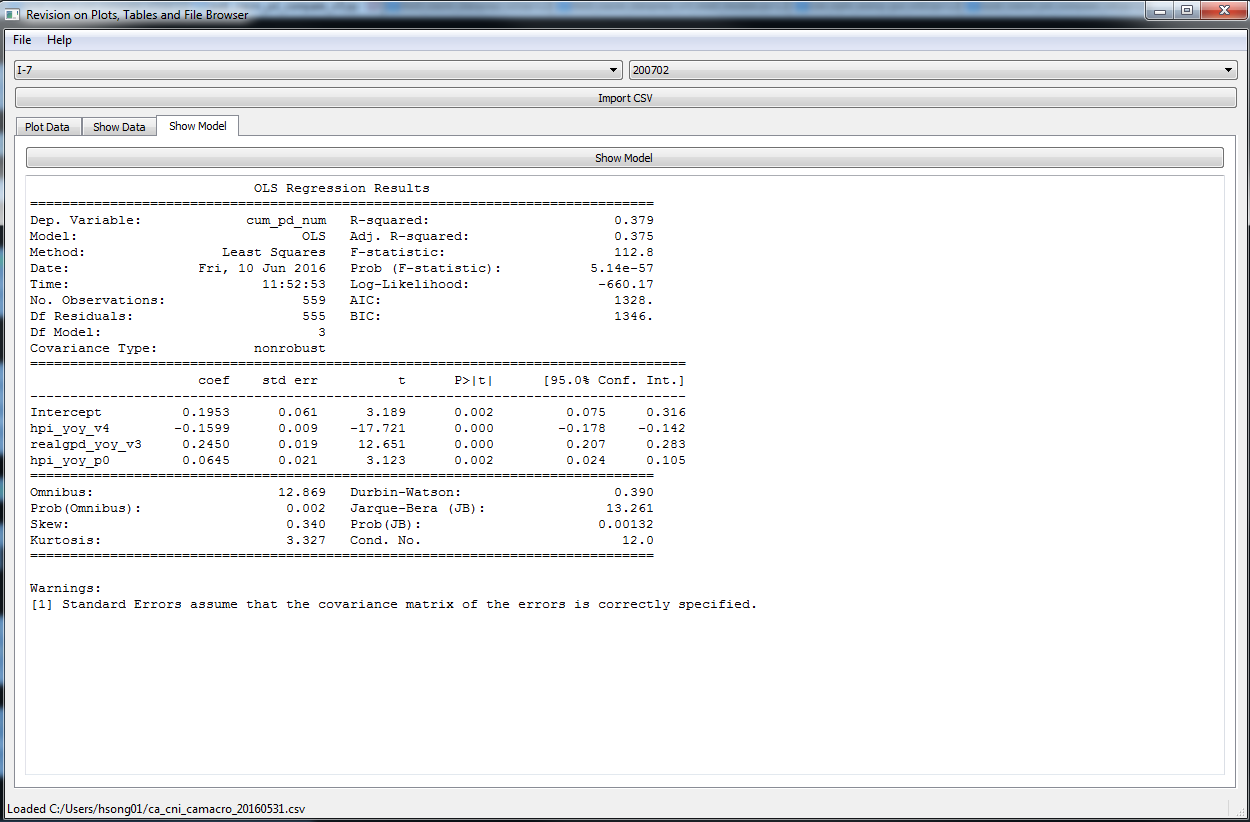
def show_model(self):
font = QtGui.QFont()
font.setFamily('Lucida')
font.setFixedPitch(True)
font.setPointSize(10)
self.textEdit3.setCurrentFont(font)
selmodel = self.creSelectModel[str(self.comboBox.currentText())]
self.textEdit3.setText(selmodel)
def print_data(self):
font = QtGui.QFont()
font.setFamily('Lucida')
font.setFixedPitch(True)
font.setPointSize(10)
p1 = self.df.ix[(self.df.rating == str(self.comboBox.currentText())) & (self.df.yq == int(str(self.comboBox2.currentText()))), :]
# self.textEdit.setText(p1.to_html(col_space = 10, index = False, justify = "right"))
self.textEdit.setCurrentFont(font)
self.textEdit.setText(p1.to_string())
def create_status_bar(self):
self.status_text = QtGui.QLabel("Please load the csv file: ca_cni_camacro_20160531.csv!!")
self.statusBar().addWidget(self.status_text, 1)
def create_menu(self):
self.file_menu = self.menuBar().addMenu("&File")
open_action = self.create_action("&Open File | Import CSV", slot = self.getCSV)
quit_action = self.create_action("&Quit", slot = self.close, shortcut = "Ctrl+Q", tip = "Close the App")
self.add_actions(self.file_menu, (open_action, None, quit_action))
self.help_menu = self.menuBar().addMenu("&Help")
about_action = self.create_action("&About", shortcut = 'F1', slot = lambda: self.on_about("About the App", "Demo of IFRS9 PD Plot"))
self.add_actions(self.help_menu, (about_action, ))
def on_about(self, msg_title, msg):
QtGui.QMessageBox.about(self, msg_title, msg.strip())
def add_actions(self, target, actions):
for action in actions:
if action is None:
target.addSeparator()
else:
target.addAction(action)
def create_action(self, text, slot = None, shortcut = None, icon = None, tip = None, checkable = False, signal = "triggered()"):
action = QtGui.QAction(text, self)
if icon is not None:
action.setIcon(text, self)
if shortcut is not None:
action.setShortcut(shortcut)
if tip is not None:
action.setToolTip(tip)
action.setStatusTip(tip)
if slot is not None:
self.connect(action, QtCore.SIGNAL(signal), slot)
if checkable is not None:
action.setCheckable(True)
return action
def getCSV(self):
self.comboBox.clear()
self.comboBox2.clear()
filePath = QtGui.QFileDialog.getOpenFileName(self,
'Single File',
'~/Desktop/MyCSVFile',
'*.csv')
print filePath
self.df = pd.read_csv(str(filePath))
self.rating_list = self.df.rating.unique().tolist()
self.yq_list = [str(x) for x in self.df.yq.unique().tolist()]
self.comboBox.addItems(self.rating_list)
self.comboBox2.addItems(self.yq_list)
print self.rating_list
self.status_text.setText("Loaded " + str(filePath))
def plot(self):
y = []
for n in range(3):
try:
y.append(self.table.item(0, n).text())
except:
y.append(np.nan)
p1 = self.df.ix[(self.df.rating == str(self.comboBox.currentText())) & (self.df.yq == int(str(self.comboBox2.currentText()))), :]
print p1
plt.cla()
ax = self.figure.add_subplot(111)
ax.plot(p1.ix[:, 0], 'g', label = "Pred on data with Model")
ax.plot(p1.ix[:, 1], label = "adj Pred to non-decreasing")
ax.plot(p1.ix[:, 3], label = "Fitting value in Model")
ax.plot(p1.ix[:, 2], 'r', label = "Actual PD")
ax.plot(p1.ix[:, 4], 'y', label = "Long Run Avg")
ax.set_title('Canada C&I PD Plot')
ax.legend(loc = 0)
self.canvas.draw()
self.textEdit.clear()
def center(self):
qr = self.frameGeometry()
cp = QtGui.QDesktopWidget().availableGeometry().center()
qr.moveCenter(cp)
self.move(qr.topLeft())
def main():
app = QtGui.QApplication(sys.argv)
w = PrettyWidget()
app.exec_()
if __name__ == '__main__':
main()
Figure 1. tab1: show the plot
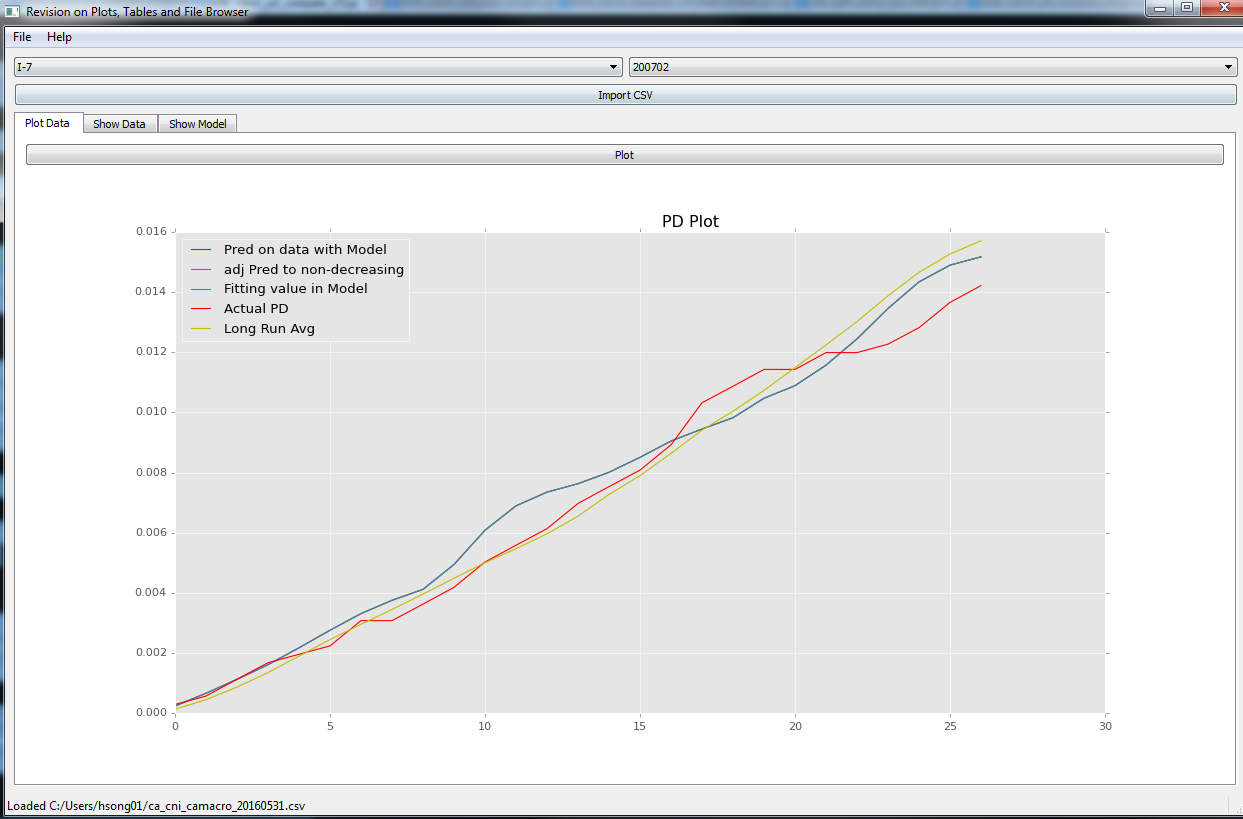
Figure 2. tab2: show the data
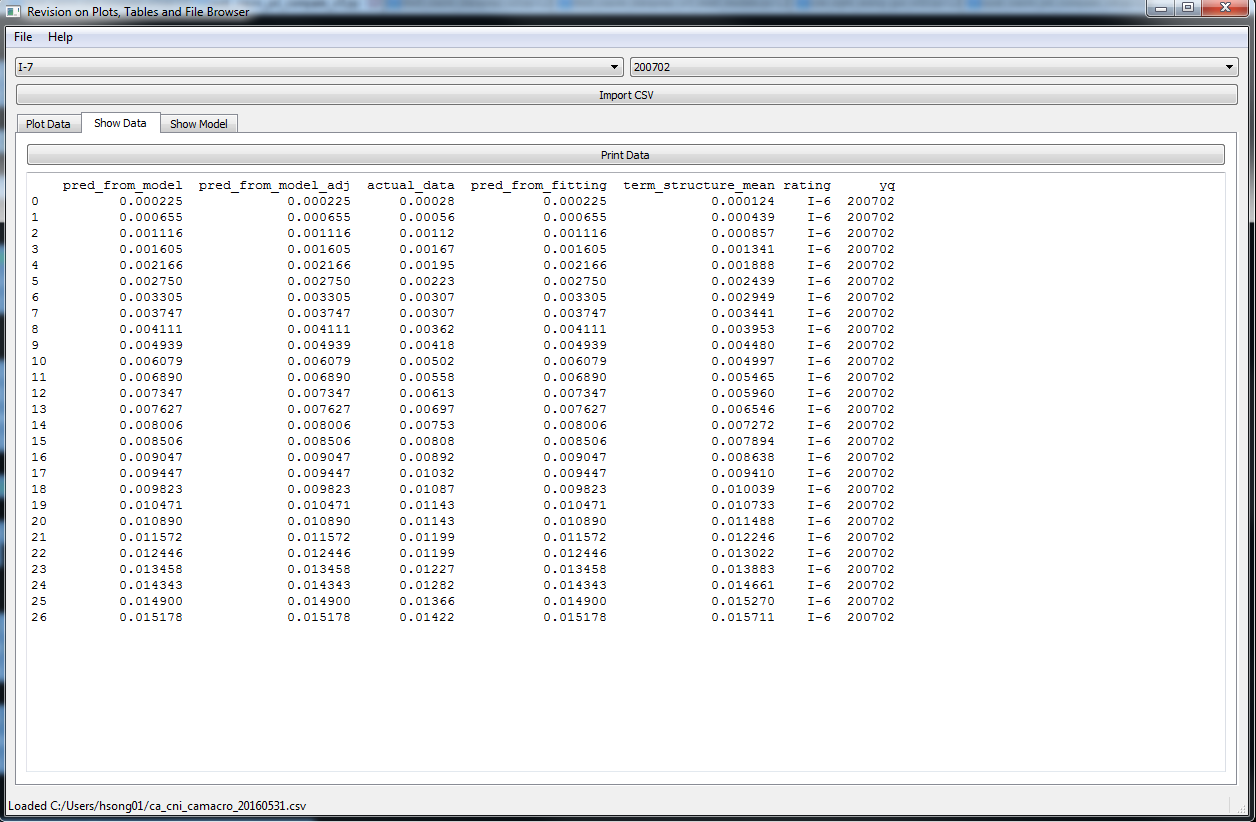
Figure 3. tab3: show the model