这是我觉得很好的一篇知乎文章,原作者不仅简明扼要的把一个问题转化为数学问题,把书本上关于Ito积分应用到现实问题中,而且给出了一个Simulation解,做到了让人真正明白是怎么回事。
原文参见知乎。以下摘自原文。
原始问题是:买入股票时,买入价至少设为多少才能保证有九成的把握在当天成交?假定股价服从布朗运动。下单后不可修改。
下面完全是引用的最高票答案:
既然题目里面说了Brownian Motion,我只说说从金融数学的角度怎么处理这个问题,至于行为经济学、市场文化学这些太抽象,相关答案很多,我就不多嘴了。现在欢迎大家来到Q-measure(Risk-neutral Probability measure)。
这是程序做市(Electronic Market Making)里面常见的一个问题,不过这些假设太粗糙了,必须要加的一个条件是:购买股票,下限价订单(Limit order)——否则如同大部分答案所说——假设是市场订单(Market Order),那成交概率是100%。
如同游戏先要弄懂如何打金刷怪一样,数学没有前提条件做啥都是白瞎。前提假设先说清楚——所有市场无套利的假设全部装备,假设初始股价\(S_0\),股票年化波动性\(\sigma\),时间\(\frac{1}{252}\),由于一天之内,就不考虑分红了\(d = 0\),利率也没有影响\(r = 0\)。我们要求\(S_{bid}\),满足:\(P\left(\inf\left\{ S_t \lvert ~ t \in (0, T) \right\} \leq S_{bid}\right) = 90\%\),即股价在一天之内的下界小于等于的概率等于90%。因为此概率对于\(S_{bid}\)单调递增,故由唯一解。原问题可以两种做法,解析法和模拟法。
1. 解析法:
设符合条件的买入价为\(S_{bid} \leq S_0\),根据假设,股价服从Geometric Brownian Motion:
因此,根据Ito's Calculus,我们有:
变形,易得:
定义:
那么\(m(t)\)就是0到t时刻中对数股价的下界。由于对数函数的单调递增性质,我们的目标转化为:
由于我们有:
我不加证明的给出\(m(t)\)的累积分布函数(CDF)如下,证明需要利用布朗运动的反射性质(Reflection Principle),有兴趣的可以要我补充:
那么利用这一函数的反函数,分分钟搞定这个问题的解析解:
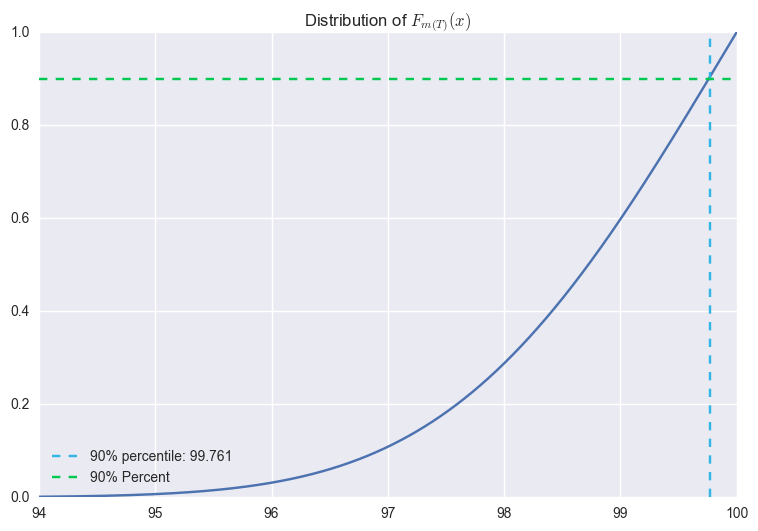
如有谬误,欢迎指出。这里不妨看看解析解对应的函数曲线(假设\(S_0 = 100, \sigma = 0.3\)):
由于我们恒有\(m(t)\leq S_0\),故\(F_{m(T)}(S_0)=100\%\)。而根据解析解,我们有: \(\exp\left(F^{-1}_m(T)(90\%)\right)=99.77\)。即在开盘价99.77%的水平下单,可以满足条件。
\(F_{m(T)}\)的分布函数不是很好反解。模拟了一下它的结果:
import numpy as np
import pandas as pd
import matplotlib.pyplot as plt
from scipy import stats
import scipy.stats as st
import seaborn as sns
%matplotlib inline
plt.rcParams['figure.figsize'] = (9, 6)
mu = -0.5 * 0.3**2
alpha = np.log(100)
capt = 1/252.0

x = np.log(99.761)
p = st.norm(alpha + mu*capt, 0.3*np.sqrt(capt)).cdf(x) + np.exp(2 * mu * (x - alpha) / 0.3**2) * st.norm(alpha - mu*capt, 0.3*np.sqrt(capt)).cdf(x)

res = []
xrange = np.arange(94, 100, 0.001)
for i in xrange:
    x = np.log(i)
    v = st.norm(alpha + mu*capt, 0.3*np.sqrt(capt)).cdf(x) + np.exp(2 * mu * (x - alpha) / 0.3**2) * st.norm(alpha - mu*capt, 0.3*np.sqrt(capt)).cdf(x)
    res.append(v)


plt.plot(np.arange(94, 100, 0.001), res)
plt.axvline(x = 99.77, color = '#33b5e5', linestyle = '--', label = "90% percentile: 99.761")
plt.axhline(y = 0.9, color = '#00C851', linestyle = '--', label = "90% Percent")
plt.legend(loc = 3)
plt.title("Distribution of $F_{m(T)}(x)$")
plt.show()

res_s = pd.Series(res)

ss = pd.Series(xrange)
fx = ss[res_s[(res_s-0.9<0.0005) & (res_s-0.9>0)].index[0]]
print("The 90th quantile is %.4f" %(fx) )

The 90th quantile is 99.7610
2. 模拟法:
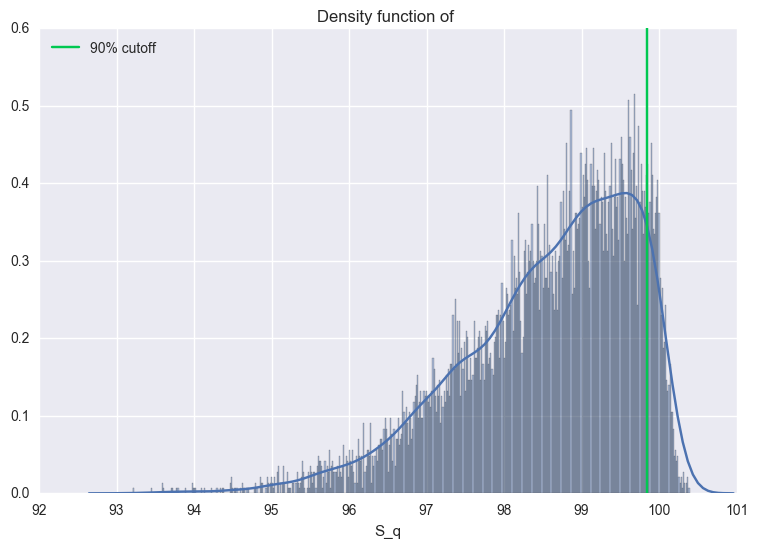
简单来说就是做一次Monte Carlo的模拟,然后模拟N次股票的轨迹,取每个轨迹的下尾90%分位点.直接模拟\(\ln S_t = \ln S_0 + \left(- \frac{1}{2} \sigma^2 \right) t + \sigma W_t\),其中\(W_t\)是布朗运动。
S0 = 100
sigma = 0.3
mu = 0
deltaT = 1.0/252
N = 10000
M = 200
barrier = 0.45

S_q = []
for i in range(N):
    ts = np.arange(M)/float(M)
    St = S0 * np.exp((mu - 1/2.0*sigma**2)*ts*deltaT + sigma * np.sqrt(deltaT / M) * np.cumsum(np.random.normal(0, 1, M)))
    S_q.append(min(St))

dis = pd.Series(S_q, name = "S_q")

# dis.plot(kind = "density")
# plt.show()

# density = stats.kde.gaussian_kde(dis)
# xs = np.linspace(min(dis), max(dis), 200)

# plt.plot(xs, density(xs))
# plt.show()

sns.distplot(dis, bins = 500)
plt.axvline(x = np.percentile(dis, 90), color = '#00C851', label = "90% cutoff")
plt.legend(loc = 2)
plt.title("Density function of ")

np.percentile(dis, 90)
99.841974221885323
